Okay, here we go. For this I assume that Wazuh file is available in the same server as the Network Probe.
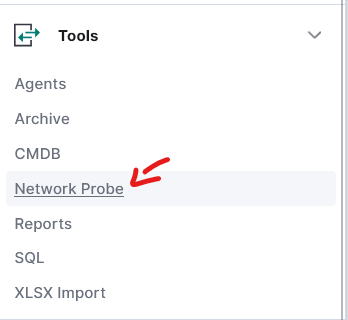
First, we jump to Network Probe module:

We deploy pipeline to selected probe. Depending on how many Probes you have, you'll have that many options. By default, there should be at least one. After it's deployed you can click on the green box to go into that specific Network Probe. This is important to remember - if you have more than one Probe, remember to verify in which probe you are currently in.

In my deployment custom pipeline isn't working, because there are no files.

To fix this i quickly jump to my linux console, and create simple file by using following:
vim /etc/logstash/conf.d/custom/custom.conf
chown logstash: /etc/conf.d/custom/custom.conf
In the content of the file I've added:
input {}
filter {}
output {}
After that manual change I have to Re-register files. Using button Probe is scanning it's filesystem and shows new files. This might take a minute or two.

After file is registered and is visible in the UI, I can edit it with proper configuration:

input {
file {
type => "wazuh-alerts"
path => "/var/ossec/logs/alerts/*/*/*.json"
codec => "json"
}
}
filter {}
output {
logserver {
hosts => ["https://<ELS_IP>:9200"]
index => "wazuh-alerts-new"
ssl => true
ssl_certificate_verification => false
user => "${LOGSTASH_USER}"
password => "${LOGSTASH_PASS}"
}
}
Once I'm done I click on the Reload button to make Probe load all the changes I've done to pipelines.

If everything went smooth, new events should be flowing to index wazuh-alerts-new. Now, this might take a moment, depending on how often new entries are being added to the wazuh file.
But this is still a start, as we missed whole filtering section. Our goal for this was to make sure data is going to the Logserver. Once we have it, later we can enhance it and refine it.
In the statistics of the Pipeline you can actually see if pipeline is ingesting and processing something.

Let me know if it worked and if I can help you with anything else. 🙂